
Wine Retailer Email Marketing Evaluation

Summary
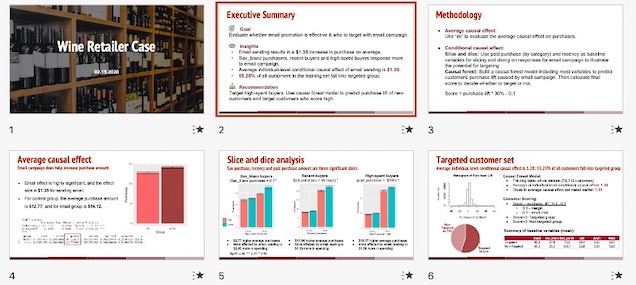
- Goal: Evaluate whether an email promotion is effective & who to target with email campaign
- Data: Experiment data on email promotion, customers’ past purchase behavior data
- Methodology:
- Use linear regression to evaluate the average causal effects (ACE) of email treatment on purchase;
- Perform slice and dice analysis to evaluate the evaluate the conditional causal effects (CCE) of email treatment on purchase;
- Build a causal forest model to predict the individual-level customer purchase-lift caused by email campaign
- Result: Able to identify email targeted segmentation based on past behaviors. Also, an individual-level scoring system is built in order to target email cost-effective customer set.
Scenario
In this project, I worked for a wine retailer that is running email marketing experiments to evaluate offers prior to sending the offers to a broader set of customers. In this experiment, the team examined the impact of an email that was intended to drive purchases. The goal of my analysis is to evaluate whether the promotion is effective and who to target with the email campaign.
Data
The data I have is the experiment data (whether the customers received email treatment and their responses), and the customers’ historical purchase behavior data(amount purchased of specific wine types in past, days since last visit, etc).
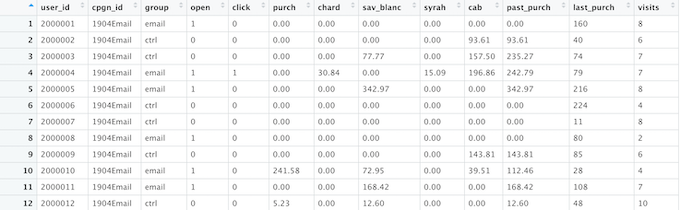
Also, the analytics team estimates the average cost of sending an email of approximately 10 cents. And while margins vary on products, the team has been using a simple 30% margin rule to apply to all products.
Analysis
Step1. Average causal effect evaluation with lm
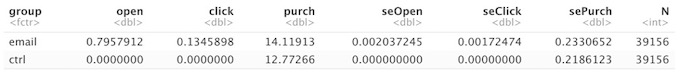
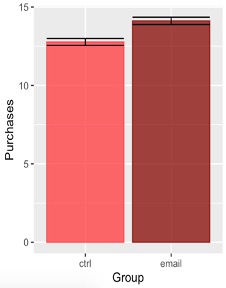
First, I depict the average effects in table and graph form as follows. In this project, I focus on the purchase variable as the response variable.
To evaluate the average causal effect on purchases, I use run linear regression(lm) in R as follows.
##### Step 1: Linear Regression #####

# use lm to evaluate the average causal effect on purchases
summary(lm(purch~group,data=d))
# adding controls separating emails
summary(lm(purch~group+chard+sav_blanc+syrah+cab+last_purch+visits,data=d)) 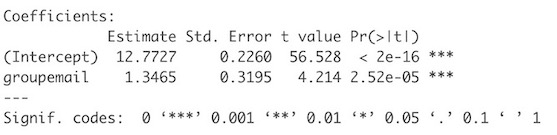
From the regression result I can conclude that Email effect is highly significant, and the effect size is $1.35 purchase lift by sending email. For control group, the average purchase amount is $12.77, and for email group is $14.12.
Step2. Conditional causal effect evaluation with Slice and Dice Analysis
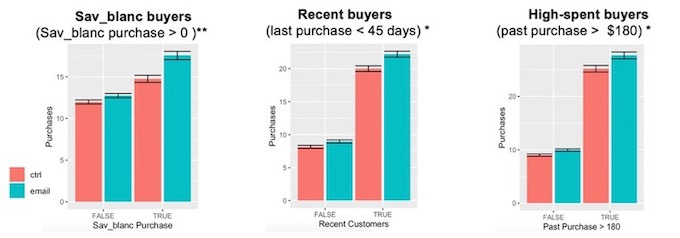
Email promotion may be more effective to certain segments than to others. For example, from the data I noticed that the email seems to produce a stronger effect on purchases for more recent buyers. Therefore, in this part I am going to use Slicing and Dicing to evaluation the conditional causal effects of email promotion on purchase, that is, to find out if sending email is more effective to certain groups.
I slice the customers based on the baseline variables in the dataset, including Chard Purchase, Sav_blanc Purchase, Cab Purchase, Last Purchase - recency 45 days, Past Purchase – greater than $180.
##### Step 2: Slice and Dice #####

#Slice based on Sav_blanc Purchase
dt = data.table(d)
dagg = dt[,.(open = mean(open), click=mean(click), purch = mean(purch),seOpen = sd(open)/sqrt(.N), seClick=sd(click)/sqrt(.N), sePurch = sd(purch)/sqrt(.N),.N),by = .(group,savpur)]
dagg
ggplot(aes(fill=group,y=purch,x=savpur,ymax=purch+sePurch,ymin=purch-sePurch),data=dagg) + geom_bar(position=dodge,stat="identity") + geom_errorbar(position=dodge) + labs(x="Sav_blanc Purchase",y="Purchases")
summary(lm(purch~group*savpur,data=d)) ## interaction coef significant**
From the graghs below, we can see that Sav purchase, recency and past purchase amount are three significant slices. That is, sending email to Sav_blanc buyers, recent buyers, and high-spent buyers results in a higher purchase lift than to other segments. Therefore, it’s more effective to send email promotion to these segments.
Step3. Conditional causal effect evaluation with Causal Forest
In this part I will leverage a Machine Learning method, Causal Forests, to further the causal effect study. Causal forests are random forests designed to categorize customers according to their treatment effect in an experiment. The customers in each leaf are assumed to have homogeneous treatment effects, with heterogeneous treatment effects between leaves.It’s an alternative to regression for identifying heterogeneous treatment effects and scoring customers based on predicted treatment effect uplift. It works well with a large number of baseline variables, and will fit non-linear relationships between baseline variables and uplift.
##### Step 3: Causal forest #####
# Causal forest: use the whole dataset as training data
treat <- d$group =='email'
response <- d$purch
baseline <- d[, c("chard", "sav_blanc", "syrah", "cab","last_purch", "visits")]
cf <- causal_forest(baseline, response, treat,seed = 66)
# predict causal effect estimates for each individual in the dataset
pur <- predict(cf, d[,c(7,8,9,10,12,13)], estimate.variance = TRUE)[,1]
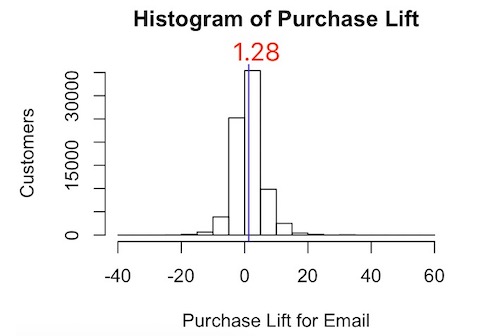
hist(pur,
main="Histogram of Purchase Lift",
xlab="Purchase Lift for Email", ylab="Customers")
abline(v=coef(lm(purch~group,data=d))[2],col=2)
abline(v=average_treatment_effect(cf, method="AIPW")[1],col=4)From the histogram below, we can see the distribution of the predicted purchase lift from email promotion on purchase for all the customers in the dataset, with $1.28 as the average individual-level conditional causal effect, which is close to average causal effect estimated earlier $1.35.
Step4. Scoring system for Targeted segment
Finally, I use the individual-level predicted purchase lift estimated by the causal forests model along with the margin and cost information to score each customer.
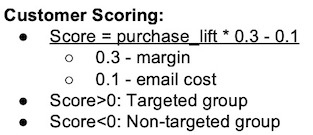
Then I get a list of customer scores with indicators on whether to send emails or not.
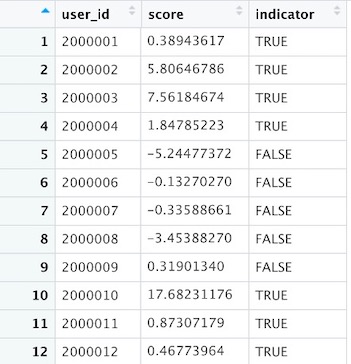
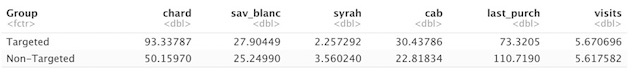
From the dataset, 55.25% of all customers fall into targeted group, with the summaries(mean) of the baseline variables for the targeted and non-targeted groups shown as below. It’s not difficult to see that customers in the targeted group are obviously Chardonnay lovers as well as recent buyers.
Final Report
Key Words: R, Regression, Causal Forests, Slice and Dice, Incrementality, Experiments, Email Marketing